The low-income students who participate in the country’s largest K-12 private school choice program are keeping pace with students of all income levels nationally, according to the latest independent evaluation.
The latest annual report, released Tuesday, tracks learning gains for participants in the Florida tax credit scholarship program in the 2012-13 school year.
Overall, the results are similar to previous years. The report shows students who participate in the program are among the state’s most disadvantaged, and that on average, they meet one of the most basic expectations for student learning: A year’s worth of growth after a year’s worth of instruction.
Each year, schools that serve students on the scholarship program report their test scores to an independent research team led by David Figlio of Northwestern University, who analyzes their performance on national norm-referenced tests and compares the results to students nationwide.
This is the seventh such report, and the bottom line is familiar. As Figlio writes, tax credit scholarship “participants on average keep pace with national norms, suggesting that they neither gain ground nor lose ground on average relative to a national peer group that includes not just low-income families but also higher-income families.”
The report also finds:
- Students who participate in the program, which is expected to serve 67,000 next year, tend to be among the most disadvantaged, not only compared to public school students as a whole, but also among the low-income students who qualify for scholarships.
- They come disproportionately from low-performing schools, and tend to be among the lowest performers on standardized tests, a tendency Figlo notes is “becoming stronger over time.” Similarly, students who leave the program and return to public school tend to be the lowest performers among scholarship students.
- The typical student in the program scores in the 47th percentile nationally in reading, and in the 45th percentile in math – numbers Figlio notes have changed very little over time.
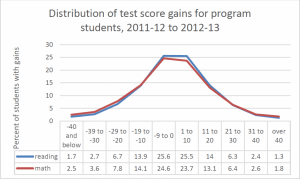
Data on student learning gains have more or less held constant from one year to the next, though the report notes wide variation among students in the program. More than one in 10 students fell behind by more than 20 percentile points in reading, while exactly one in 10 made outsize gains of the same amount. The numbers for math were similar.
There was also major variation between schools.
As he has for the past two years, Figlio reports the gain scores for individual schools with more than 30 students with reported test results (there were 110 such schools in 2012-13). Three-year averages show scholarship participants at 16 schools making more than a year’s progress in a year’s time, and participants at 19 schools making less.
This year, for the first time, he took a deeper dive into the differences between schools, based on data they report to the National Center for Education Statistics. The data come from school surveys that are a few years older than the administrative records used to calculate learning gains. Still, Figlio points to some rough conclusions about the relationship between schools’ characteristics and their students’ performance.
Among the most noteworthy results: He finds no discernible relationship between the proportion of schools’ students on scholarship, and the schools’ reported learning gains for program participants. That means that while there may be differences between schools that serve large numbers of low-income scholarship students and those that don’t, “it does not appear to be related to student gains.”
The data also show scholarship students at non-religious schools made slightly larger gains in math than their counterparts in religious schools. And some types of religious schools performed better than others. For example, private-order Catholic schools (e.g. Jesuit schools) made larger gains on average than other types of Catholic schools, and also outperformed their non-religious counterparts in both reading and math.
Another key finding: Lower student-to-teacher ratios do not appear to be associated with larger learning gains. But the length of the school year does.
Figlio finds that schools with years longer than 180 days posted larger gains in both reading and math, while performance of students at schools with fewer than 180 days tended to lag. Nearly three-quarters of the schools in the program taught for exactly 180 days, which is also the norm in public schools.
Because of the time lag in the data and the differences between school surveys and administrative records, Figlio sounds a note of caution about this part of the report. It’s possible these results are shaped by other factors, like the characteristics of students who enroll in different types of schools. While he avoids jumping to conclusions about “quality differences,” he notes some school characteristics “are potentially suggestive of differences in school performance.”
Legislation passed earlier this year shifts the responsibility for future reports to the Learning Systems Institute at Florida State University, which will be expected to publicly report data for more individual schools. Figlio’s team is helping with data collection for next year’s report, which could look a little different.
The tax credit scholarship program is administered by scholarship funding organizations like Step Up for Students, which co-hosts this blog. Previous program evaluations are available through the Florida Department of Education.


[…] Students in the nation’s largest school choice program are mostly low-income but perform at na…, far better than their demographic counterparts nationwide, a new evaluation […]